Graphical analysis on DEPT:
Create view in Model Project.

Figure 1
Here we are going to create a read only view using a SQL query which is as followsselect count(empno),Sum(SAL),DEPTNO from emp group by DEPTNO. We can use the query in the query section of configuration wizard of that view.
Figure 2
Add View in Application Module

Figure 3
Created view needs to be added with existing application module so that it becomes visible from user interface through data control.

Figure 4
We can change the default view name to any suitable name
Modifying Appearance

Figure 5
Previously only single "panelFormLayout" exists under "first" facet and that panelFormLayout holds entire form where we can create and delete employee, now we create a panelAccordion under first facet, which allow us to switch between more than one panel at runtime which comes under that panelAccordin. Here page structure becomes

Figure 6

Figure 7
Add Graph in Page

Figure 8
Select "GraphDeptViewObject" under "SampleAppModuleDataControl" and drag it to the region under "Emp Count-Dept" detail item. We will be prompted to use rich face from available rich faces. We need to select graph.
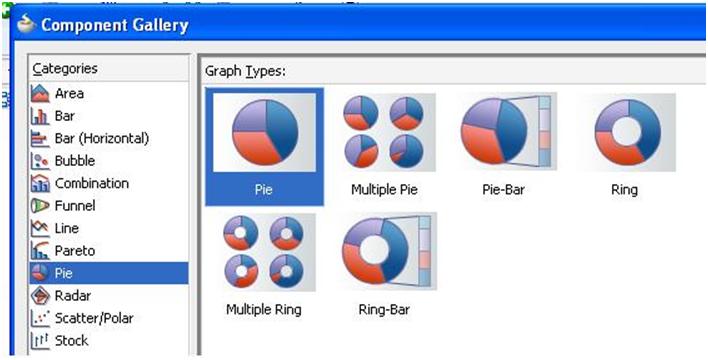
Figure 9
From a list of all available graph items I have taken pie as an example,

Figure 10
We need to monitor on number on employees on a particular department so each and every slice of pie corresponds to a department and the data points on that pie will be selected from a list of dropdown box that comes beside "Pie" label.

Figure 11
Click on Expenses- Dept tab and select "GraphDeptViewObject" under "SampleAppModuleDataControl" and drag it to the region under "Emp Count-Dept" detail item. We will be prompted to use rich face from available rich faces. We need to select graph. Here I have taken "Bar" as a display model.

Figure 12
We need to monitor total salary for each and every department so each bar pertaining to a department shows total salary and X axis depicts department.

Figure 13
This is the complete view of our resultant page.
Test and Deployment

Figure 14
Good attempt Anindya. This blog will help beginners to understand ADF
ReplyDelete